About CAIT-NV
Development, methodology, and technical foundation
Introduction
CAIT-NV started as an experiment to answer two questions: How much better is IRT than classical test theory? Turns out, significantly better. Second: Is adaptive testing actually worthwhile? Absolutely. The results speak for themselves.
Origins & Development
EqusG made CAIT as a WAIS-IV clone. Didn't quite hit the mark—CAIT's g-loading is ~.76 vs WAIS-IV's ~.90. Strip out the verbal stuff and it's basically the same at ~.75.
Instead of throwing it out, we retooled it with IRT. Could IRT fix CAIT? We made it nonverbal to reach more people, culturally fair, and much shorter for practical reasons. Original CAIT took 60 minutes. Ours? 10 minutes. 6x faster and more accurate. Average g-loading went from ~.76 to ~.83.
Spearman's Law of Diminishing Returns
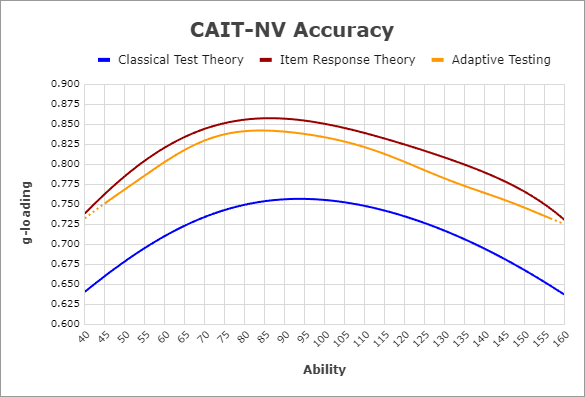
This graph demonstrates the power of IRT and adaptive testing. What drives accuracy is item quality, and IRT weighs items by their discrimination and difficulty parameters rather than treating them all equally. Adaptive testing then selects the most informative items for each ability level, maximizing measurement precision. The Spearman's Law of Diminishing Returns (SLODR) effect is visible here: at ability extremes (very high or very low IQ), item quality tends to degrade, resulting in less precise measurements and lower g-loadings. This is why prioritizing high-quality items matters so much. CTT falls short because it treats every item identically regardless of psychometric quality. IRT provides superior accuracy by accounting for item characteristics, even though CTT remains easier to implement for basic testing scenarios.
Test Design & Item Types
CAIT-NV borrows three item types from WAIS, each targeting different facets of g:
Using multiple item types gives better coverage of g and reduces method variance issues.
Item Response Theory
CAIT-NV uses an IRT model to calibrate items and estimate ability. It accounts for:
Item Discrimination (a-parameter)
Indicates how effectively an item distinguishes between examinees with different ability levels. Higher values mean the item provides more information about the latent trait, especially around a specific ability point.
Item Difficulty (b-parameter)
Represents the point on the ability scale (typically ranging from -3 to +3) where the item is most informative. This differs from classical difficulty (proportion correct), as it's expressed in terms of the latent trait.
Item Characteristic Curve (2PL)
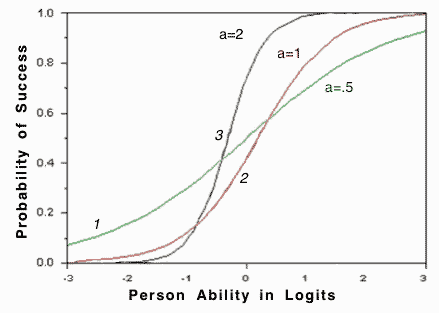
The probability of getting an item correct:
With item parameters in hand, Bayesian inference finds the most likely ability score for your response pattern.
Adaptive Testing Algorithm
CAIT-NV implements a maximum information selection algorithm that dynamically tailors the test to each individual. The algorithm selects items that provide the most information at your current ability estimate, creating a more efficient and personalized testing experience compared to traditional fixed-length assessments.
Adaptive Item Selection Process
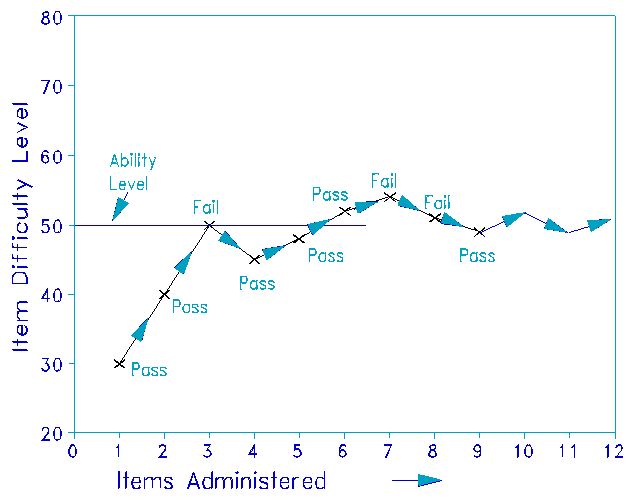
The algorithm operates through these key steps:
- Initialization: Testing begins with an initial ability estimate of θ = 0 (representing average ability), with slight randomization to vary the sequence of opening items across test-takers.
- Ability Re-estimation: After each response, the algorithm re-estimates your ability using Bayesian inference, incorporating all previous responses to refine the estimate.
- Item Selection: The next item is selected to maximize information at the current ability estimate, ensuring each question contributes meaningfully to measurement precision.
- Content Balancing: The algorithm maintains balanced representation across all three item types (Figure Weights, Visual Puzzles, Block Design) throughout testing.
- Termination Criteria: Testing concludes when measurement precision reaches SE ≤ 0.5 or after administering 30 items, whichever comes first.
Adaptive vs. Full-length Test Correlation
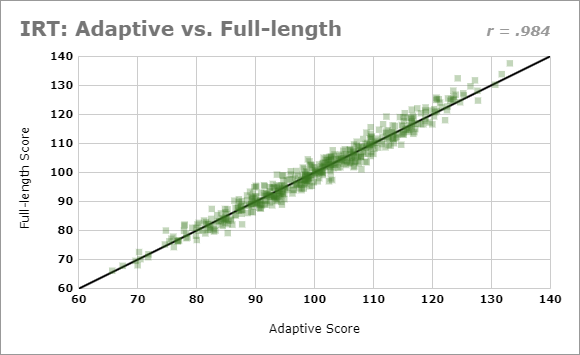
This adaptive approach delivers several key advantages over traditional testing:
- Efficiency: Achieves equivalent reliability with just 30 items compared to the full 83-item bank, reducing testing time by approximately 64%.
- Personalization: Items are matched to your ability level, minimizing frustration from overly difficult items and boredom from overly easy ones.
- Precision: Provides more accurate measurement across the entire ability spectrum, with particular improvements at the extremes where traditional tests often show reduced precision.
Bifactor Model Insights
A bifactor analysis of CAIT-NV's structure reveals important insights into how each item type measures intelligence. Figure Weights items emerge as the purest measure of general intelligence (g) among the three item types, showing high g-loadings with minimal influence from specific factors. In contrast, Visual Puzzles and Block Design demonstrate loadings on both the general g-factor and specific spatial reasoning factors, indicating they measure a blend of general and specialized cognitive abilities.
Bifactor Model of CAIT-NV Subtests
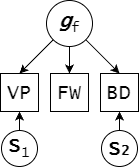
This bifactor structure has practical implications for measurement. Figure Weights items provide a cleaner signal of g with less measurement noise from specific abilities. The adaptive item selection algorithm leverages this insight, allowing strategic weighting of items based on their g-loading characteristics. This approach enables the test to provide more accurate estimates of general cognitive ability by prioritizing items with stronger g-saturation when precision is needed most.
Scoring Methodology
1. Norming & Scaling
Calibrated on an international sample of ~7,000 people. IRT scores are scaled to Luke Atronio's CTT norms (mean 100, SD 15 for US population).
2. Latent Ability Estimation
IRT with a bifactor model extracts g-scores from your response patterns. Unlike CTT which just counts correct answers, IRT weighs each response by item discrimination and difficulty to estimate your latent ability on the g-factor specifically.
CAIT-NV employs a bifactor IRT model to extract pure g-scores from response patterns. The adaptive algorithm maximizes measurement precision by selecting items with the highest information value at your current ability estimate, continuing until measurement error reaches SE ≤ 0.5 or 30 items have been administered. The reported 95% confidence interval is ±20 IQ points. This interval is wider than what you'd typically see in CTT-based tests, but the comparison isn't straightforward. CAIT-NV specifically isolates general intelligence, meaning the confidence interval reflects validity (how accurately we're measuring pure g) rather than just reliability. This is analogous to the distinction between omega hierarchical and omega total in factor analysis. If we were reporting a composite score that incorporated group factors such as spatial reasoning, the confidence interval would narrow to approximately ±10 IQ points, but at the cost of construct purity.